Advanced multi-timeframe analysis for better entries
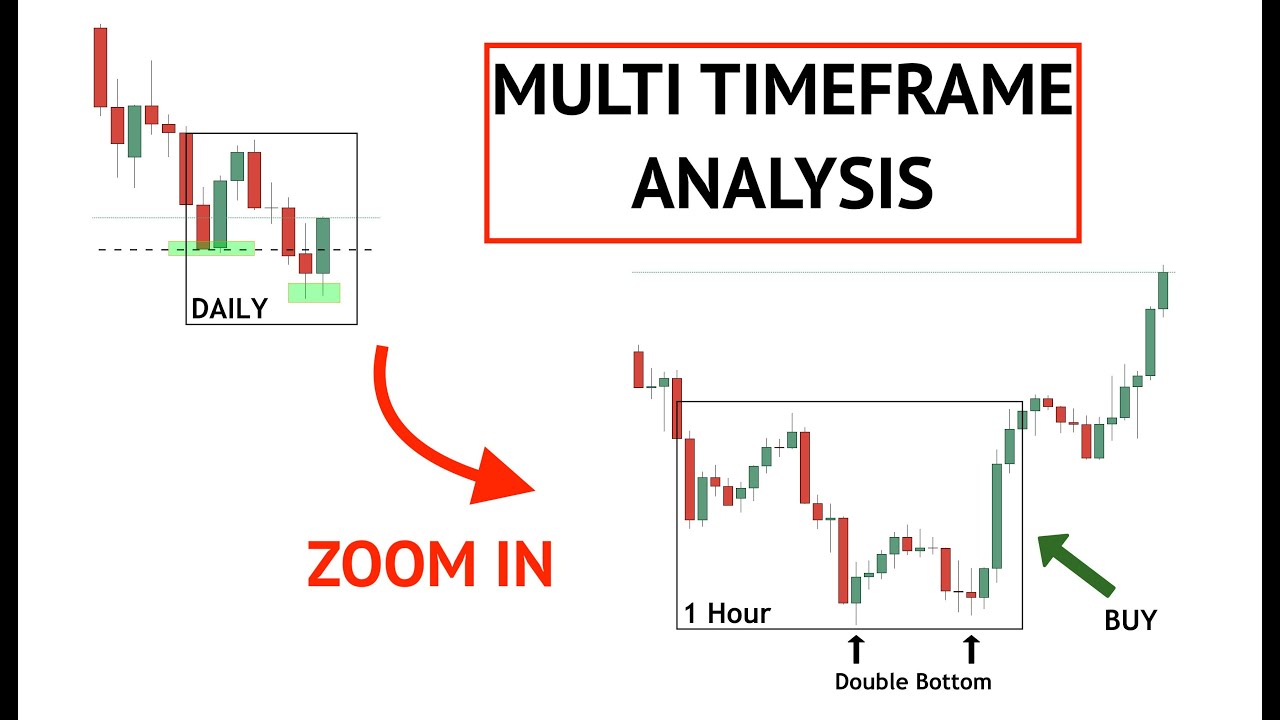
The Multi-timeframe analysis method provides traders with a structured approach to study price movements by analyzing the same currency pair across different chart time periods. The method uses two different timeframes to achieve market direction analysis while it determines exact entry points. The system connects specific trades to general market data through its method to achieve both noise reduction and better decision quality.
A trader who looks at EUR/USD on a daily chart will see an obvious price movement that indicates an upward direction. The analysis of this time period enables us to predict which market direction will occur. Moving to a four-hour chart then reveals whether price is correcting or continuing within that trend. The fifteen-minute chart serves as a lower timeframe which enables traders to enter trades with better precision while using stops that are closer to their entry points. The current framework enables investors to manage their risks during their investment decision process for determining portfolio sizes and asset allocation.
The rationale behind using multiple timeframes
The combination of different time periods allows traders to link their market predictions with their trading execution abilities. A single chart contains vital information which becomes visible when traders use multiple time periods to study price evolution between different market periods. The method enables users to make better decisions about their market entries and stop placement and position size management.
Let’s say EUR/USD shows higher highs and higher lows on a daily chart. The market conditions at present demonstrate positive indicators based on the established framework. Short trades entered on five-minute charts during this time will encounter rising obstacles from strong market directions. The risk level becomes lower when we use the lower timeframe to identify trends which match the higher timeframe. The placement of stop-loss orders based on lower chart pullbacks enables traders to set tighter stop-loss levels which determines their trading position size and required margin funds.
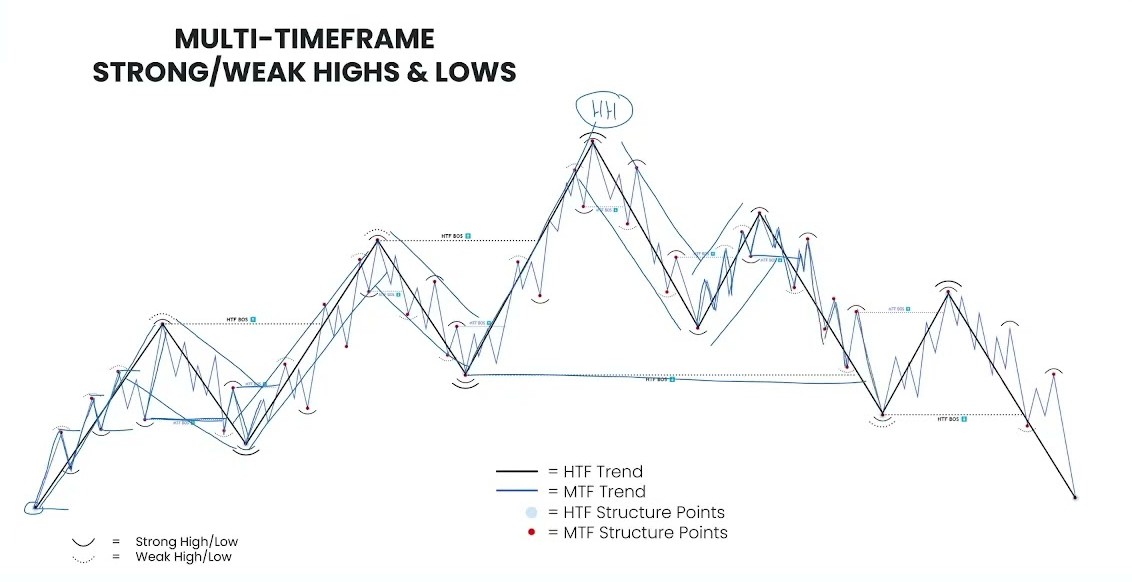
Understanding market structure across timeframes
Market structure explains how prices behave during different market phases which include price swings and trend movements and periods of stability. The analysis of this structure throughout different time periods helps us identify between long-term market patterns and short-term market fluctuations. The position of price within a complete market cycle becomes visible through analysis of higher timeframes but lower timeframes show the exact details of this price movement.
Let’s say USD/JPY forms higher highs and higher lows on a weekly chart. This indicates an upward structure. Price will experience a short-term decrease on the four-hour chart which represents a market correction instead of a complete market shift. People can prevent themselves from making incorrect assumptions about short-term decreases through their understanding of this distinction. Traders can establish their stop-loss orders at reduced distances when they enter the market during market pullbacks. A tighter stop reduces pip risk which affects both the amount of lots traders can use and the amount of margin they need to maintain.
Clear structure alignment also improves leverage control. The risk target becomes accessible when market entries reach the invalidation levels which decreases our exposure. This approach supports consistent risk management and reduces emotional decision-making.
Higher-timeframe trend identification
The direction of all trading decisions stems from timeframes which operate at extended periods. Daily and weekly charts reveal short-term market fluctuations because they show how investors continue their market transactions between buying and selling activities. The market conditions perspective enables investors to select between long and short positions before they can identify their exact entry points.
Let’s say GBP/USD shows a series of higher highs and higher lows on the daily chart. The established pattern shows that the market will continue to rise. The practice of trading with market direction allows traders to achieve better probability outcomes while it makes their risk evaluation more straightforward. The correct lot size results from calculating pip values which show how a 1 percent account equity risk at a 40-pip stop loss affects the trade. The position becomes more defendable when market direction supports our position because we can set narrow stop-loss levels which reduce needed margin while keeping suitable trading leverage.
Traders who study market trends at higher time frames can detect when trading possibilities turn out to be incorrect. The short-term breakout which occurs against the dominant trend shows brief liquidity changes instead of an actual market reversal. Traders who use higher timeframes for reference can reduce their market entry frequency which makes their trading system more dependable.
Intermediate-timeframe context and confirmation
The intermediate timeframe connects market trend patterns from the long term to short-term operational activities. The two time periods of four hours and one hour enable traders to determine if market prices follow the main trend or if they are in a correction phase or experiencing market stability. The system design includes two main features which block unauthorized system access during system startup and create better links between system assessment processes and system operational activities.
Let’s say AUD/USD is trending higher on the daily chart. The price on the four-hour chart shows a flat movement between two close boundaries. The market behavior shows that investors choose to transfer their money between various investment options instead of liquidating their present investments. The market needs to follow a particular continuation pattern during its intermediate period to verify that the main market direction continues. The calculation of pip value enables traders to increase their position size when a breakout from consolidation produces a 25-pip invalidation level instead of the typical 50 pips.
Lower-timeframe precision for trade entries
The main objective of working with brief time spans demands the production of exact results. The fifteen-minute and five-minute interval charts enable traders to locate their trading entry points following their verification of trade setups through higher and intermediate timeframes. The detailed information allows traders to establish exact stop-loss levels which helps them achieve improved market exposure management.
Let’s say USD/CAD is trending higher on the daily chart and confirmed on the four-hour chart. On the fifteen-minute chart, price pulls back toward a recent support area and shows signs of stabilization. The trader can set a stop-loss at this entry point because it will be near the point where the trade becomes invalid. The choice between using a 15-pip stop and a 40-pip stop will help you decide which method to use for determining your position size. The fixed account risk enables traders to use bigger position sizes because they can determine their needed position size through pip value calculations which do not increase their overall market risk.
The ability to achieve precise results at shorter time intervals leads to better margin performance. Users can decrease their safety distance through shorter stop distances which protect them from applying excessive force.
Aligning timeframes to avoid conflicting signals
The market shows conflicting signals when different time periods display opposing market trends. The process of trade planning becomes more efficient because all elements need proper alignment which removes confusion and establishes uniformity in the process. The system starts by using higher-timeframe analysis to determine market direction before it moves to intermediate timeframe market condition assessment and then executes trades using lower-timeframe market data.
The daily chart shows EUR/USD moving upward but the one-hour chart indicates a short-term market correction. Entering short based solely on the lower chart increases the chance of trading against dominant momentum. The pullback needs to stabilize before traders can use it to achieve market alignment between different time periods. The one-hour chart displays a base while the fifteen-minute chart indicates market entry from buyers which simplifies the process of stopping the trade. The use of a 20-pip stop instead of a 45-pip stop will impact both pip value and lot size calculations but will maintain the present level of account risk.
Aligned timeframes also help manage leverage. The use of small stops allows investors to maintain minimal margin requirements while their investments remain protected from major market fluctuations. The system implements standardized alignment filters to prevent sudden trading actions while it supports structured decision-making procedures.
Conclusion
Structured timeframe alignment improves entry quality by combining directional clarity with execution precision. Market bias develops from extended market assessments which intermediate traders apply to validate their market entries across different time periods. The three trade decision-making layers function as a unified system which generates predictable and measurable outcomes when they work together.
Let's imagine a trader who risks 1% per trade. The trading execution timeframe enables traders to set tighter stop-losses because they verify trend direction through daily charts before confirming their decisions on four-hour charts. The reduction of stop loss from 45 pips to 18 pips enables traders to increase their position size because it reduces the amount of money needed to maintain their account exposure. This directly improves margin efficiency and keeps leverage controlled.
Consistent alignment also reduces emotional decision-making. The trading strategy operates through set price levels instead of needing market price movements to start trading operations. The method generates superior long-term results which help experts evaluate their obtained results with greater precision.