Gold vs USD trading strategy
Gold and the US dollar share one of the most traded relationships in financial markets. It is not a perfect inverse — nothing in markets ever is — but the general pattern holds often enough that traders across every experience level have built strategies around it. XAU/USD, the spot price of gold denominated in US dollars, sits at the intersection of monetary policy, geopolitical risk, and inflation expectations. That makes it more complex than most currency pairs, and more reactive to macroeconomic shifts than most commodities.
The pair attracts a wide range of participants. Central banks hold gold as a reserve asset. Institutional funds use it as a hedge. Retail traders speculate on short-term price swings. Each group responds to different signals, which is part of why XAU/USD can move sharply on news that leaves other pairs relatively quiet.
Understanding the gold-dollar relationship
Gold is priced in US dollars on global markets, which creates a structural link between the two assets. When the dollar strengthens, it takes fewer dollars to buy the same amount of gold — so the price falls, all else equal. When the dollar weakens, gold becomes cheaper for international buyers, which tends to support demand and push prices up. That mechanical relationship is real, but it explains only part of what actually drives price.
The deeper dynamic is about perceived value. Gold carries no yield. It pays no dividend and accrues no interest. When the dollar is strong and US interest rates are high, investors can earn a return by holding dollar-denominated assets, which reduces the relative appeal of gold. When rates fall or the dollar comes under pressure, that opportunity cost shrinks — and gold becomes more attractive by comparison.
This is where many traders stop their analysis, and that is where errors begin. The inverse correlation between gold and the dollar is a tendency, not a rule. During acute risk-off events — financial crises, geopolitical shocks, sharp equity selloffs — both the dollar and gold can rise simultaneously as investors seek safety in different forms. Treating the relationship as mechanical, without accounting for broader market context, is a reliable way to get caught on the wrong side of a trade.
Key drivers behind the inverse correlation
Three forces do most of the work: real interest rates, inflation expectations, and the relative strength of the US economy. None of them operates in isolation.
Real interest rates — nominal rates adjusted for inflation — are widely considered the single most influential driver of gold prices. When real yields are negative or falling, the cost of holding a non-yielding asset like gold diminishes. Historically, periods of deeply negative real yields have coincided with strong gold performance. The relationship is not guaranteed, but it is consistent enough to anchor a fundamental thesis.
Inflation expectations work alongside real yields. Gold has a long-established role as a store of value, and when markets price in rising inflation, demand for that role increases. This is measured in part through the breakeven inflation rate — the spread between nominal Treasury yields and inflation-protected securities. Traders who monitor this spread often use it as a forward-looking indicator for gold demand.
The relative strength of the US economy feeds into the dollar side of the equation. Strong growth data tends to support dollar strength through expectations of tighter monetary policy. But it can simultaneously dampen gold if equities rally and risk appetite improves. The interaction is worth watching carefully — particularly around major data releases like Non-Farm Payrolls, CPI, and Federal Reserve statements — because these are the moments when the correlation either confirms or briefly breaks.

Reading the charts: technical approaches to XAU/USD
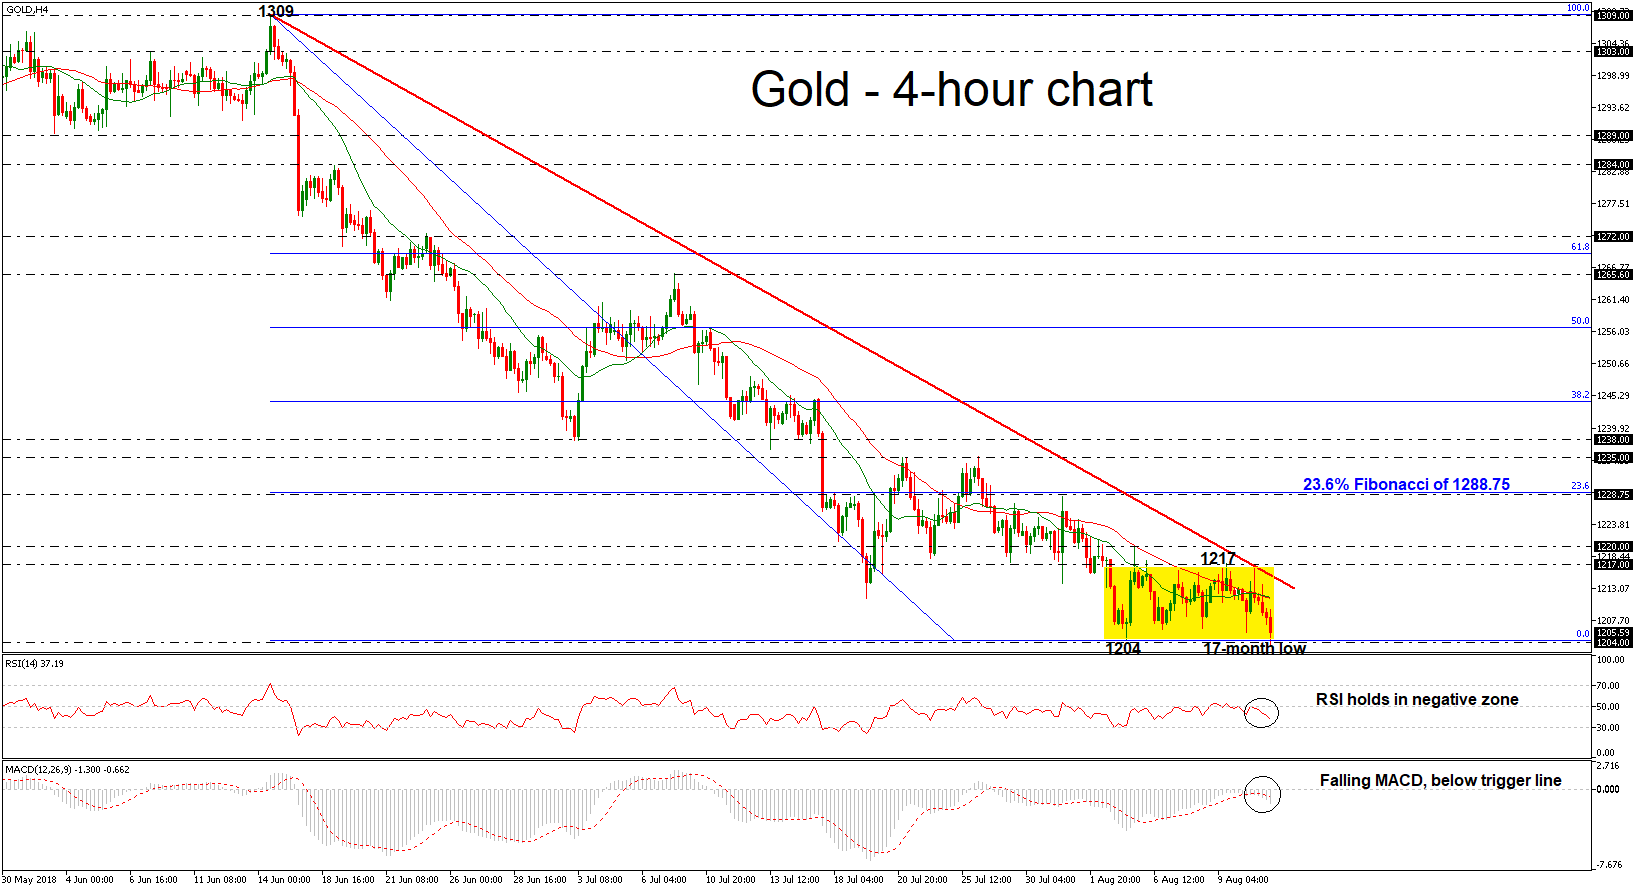
XAU/USD trends. That observation matters because it means technical strategies built around momentum and trend continuation tend to perform better on this pair than mean-reversion approaches — at least over medium time frames.
On higher time frames, the 200-period moving average is widely followed as a trend reference. Price sustained above it signals a broadly bullish structure; price below it signals the opposite. It is not a precise entry tool, but it orients the analysis. Many institutional participants reference it, which makes it self-reinforcing to a degree.
Support and resistance levels drawn from previous swing highs and lows carry particular weight on XAU/USD because gold markets have a long institutional memory. The $1,800, $2,000, and $2,500 levels, for example, have each acted as significant battlegrounds at different points in the market's recent history. Round numbers are not arbitrary — they tend to cluster order flow.
RSI divergence on the daily chart is a technique that tends to trip up newer traders when applied in isolation, but combined with a clear structural level, it can provide useful context. When price makes a new high while RSI makes a lower high, that divergence suggests weakening momentum — not a guaranteed reversal, but a reason to scrutinize entries on the long side. The same logic applies in reverse to downtrends.
Candlestick patterns near key levels — particularly engulfing patterns and pin bars — are worth noting on the four-hour and daily charts. The pair's liquidity means that false breaks are common, so confirmation through a close beyond a level carries more weight than an intrabar wick.
Fundamental triggers worth watching
The economic calendar is not optional for anyone trading XAU/USD seriously. The pair reacts to a narrower set of releases than, say, EUR/USD — but the reactions can be larger and faster when they come.
Federal Reserve communications sit at the top of the list. FOMC rate decisions, meeting minutes, and Chair press conferences all move gold because they directly affect the real yield and dollar strength calculations that drive the pair. A more hawkish-than-expected statement tends to pressure gold. A dovish pivot or signals of rate cuts tend to support it. The market's reaction is not always immediate — sometimes the repricing happens over hours or days as participants process the implications.
US CPI releases are the second major trigger. Above-consensus inflation data can push gold in either direction depending on what it implies about Fed response. If the market reads hot inflation as a signal of more rate hikes ahead, gold can fall despite inflation traditionally being a supportive driver. If inflation surprises to the upside when the Fed is already behind the curve, gold can rally sharply. Context determines the direction.
Non-Farm Payrolls, the ISM manufacturing index, and GDP revisions also influence the pair, though more indirectly. Strong US economic data generally supports the dollar and weighs on gold. Weak data does the opposite. Outside the US, any development that affects global risk appetite — central bank decisions in the eurozone, geopolitical escalation, sovereign debt concerns — can shift gold independently of dollar direction.
Practical strategy frameworks for retail traders
No single approach works for every market participant, and XAU/USD is particularly unforgiving of strategies that ignore context. That said, a few frameworks have demonstrated enough consistency to be worth understanding in structural terms.
Trend-following on the daily chart is the most straightforward. The premise is simple: identify the prevailing trend using a moving average or price structure, wait for a retracement to a defined level — a prior support zone, a Fibonacci level, or the moving average itself — and enter in the direction of the trend. Stops go below the retracement low for longs, above for shorts. The difficulty is not the theory; it is execution discipline during consolidation phases when the pair moves sideways and generates false signals.
Breakout trading around key levels is a second approach. Gold often coils before major data releases, and a confirmed break of a well-defined range — with volume confirmation where available — can initiate a sustained move. The risk here is the false break, which is more common on XAU/USD than on most major forex pairs. Waiting for a candle close beyond the level, rather than trading the wick, filters out a meaningful percentage of traps.
A macro-driven approach uses fundamental triggers as the primary signal and technical levels to time entry. For example: if the Fed has just delivered a dovish surprise and real yields are falling, a trader might look to buy XAU/USD on the next pullback to a defined support level rather than chasing the initial spike. This approach requires patience and a clear thesis, but it aligns trade direction with the forces most likely to sustain a move.
Conclusion
Trading XAU/USD well requires holding two analytical frameworks simultaneously — technical and fundamental — and knowing which one is driving the market on any given day. Neither is sufficient alone. Price action without macro context produces trades that are structurally correct but directionally wrong. Fundamental analysis without a defined entry framework produces conviction without timing.
The gold-dollar relationship offers genuine opportunity precisely because it responds to forces that are, to a meaningful degree, observable in advance. Real yields, Fed communications, and inflation data are all public information. The edge is not in knowing the data — it is in understanding the context well enough to anticipate how the market will interpret it.
Risk management is not a secondary consideration on this pair. The volatility that makes XAU/USD attractive for larger moves also means that a misjudged trade, held without a stop or oversized relative to account capital, can produce losses that take weeks to recover. Defining risk before entry — not managing it reactively after the fact — is the single most durable habit a trader can build.