How to identify false breakouts with precision
The market environment with high liquidity causes prices to exceed the typical levels where support and resistance usually occur. The market experiences a breakout when price moves through resistance levels or support levels while more investors join the market. The market shows breakouts which fail to create lasting price changes. A false breakout happens when price briefly moves beyond a key level and then reverses back into the prior range.
Understanding breakouts in the context of market structure
A breakout occurs when price exceeds a well-defined support or resistance level while many market participants take part in the movement. The majority of trading platforms enable users to detect these levels through price reversals which occur at points where previous highs and lows meet. Market structure refers to the sequence of higher highs and higher lows in an uptrend, or lower highs and lower lows in a downtrend. A valid breakout needs to follow the established pattern which the broader structure defines.
For example, let’s say GBP/USD has been forming higher lows and repeatedly testing 1.2700. The market will keep rising when price reaches 1.2700 while market volatility rises and buyers continue to buy. The market trend shows a downward direction because price faces resistance at this level and fails to maintain positions above it which makes a market failure more likely.
The Federal Reserve and European Central Bank along with other central banks create economic releases which produce brief market volatility increases. The evaluation of calendar data with previous market reactions helps us determine the proper assessment method for breakouts.
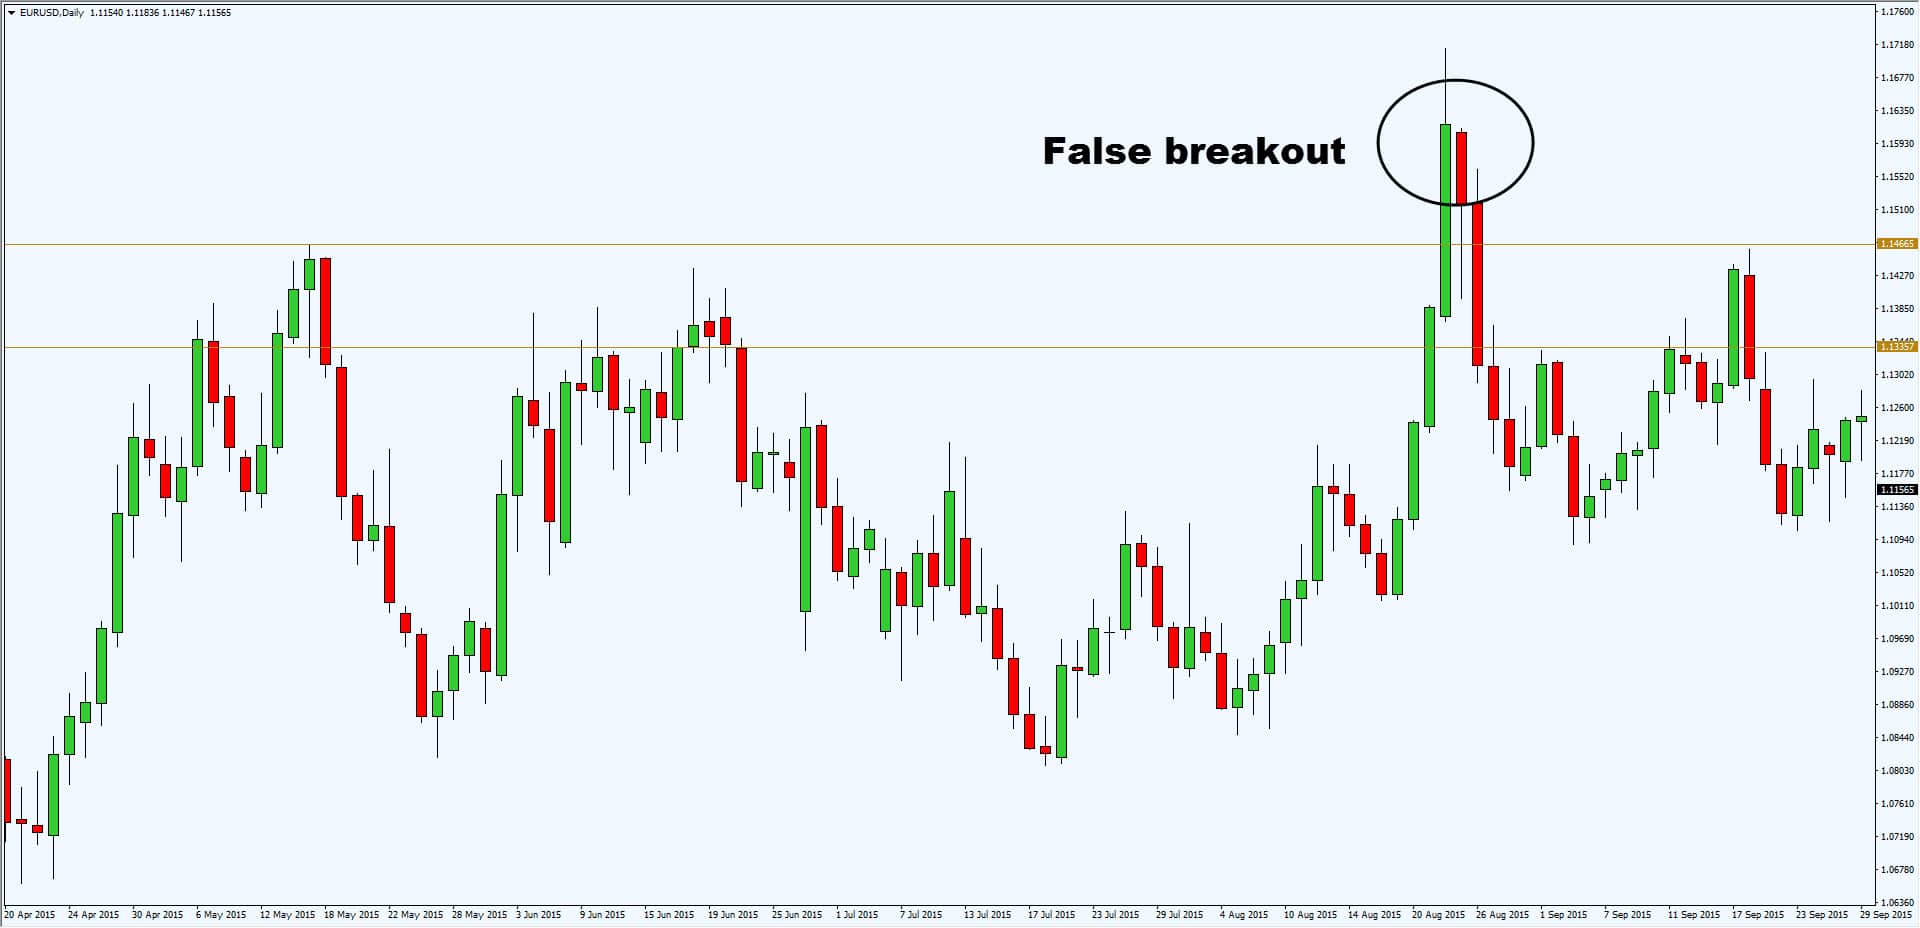
What Is a false breakout and why it occurs
The market experiences a false breakout when price exceeds established support or resistance points but unable to maintain its direction and returns to its original price range. The trading platforms enable users to see this pattern because their candles reach resistance or support levels before they revert to their starting points. The market movement could activate stop orders and breakout entry points before it starts moving in the opposite direction.
The USD/JPY exchange rate stayed below 150.00 during all trading days. The price reached 150.20 which triggered all buy stops that investors had set above the resistance level. The market will experience selling pressure when investors decide to sell their assets which will drive the price of the pair to return below 150.00. Early buyers will choose to leave the market which will create additional market pressure that drives prices lower. The market movement in this sequence results from liquidity changes instead of any actual trend progression.
The market experiences false breakouts when trading volume remains low and when economic announcements appear on the calendar. Market prices show short-term unpredictable fluctuations which do not prove any permanent changes in market structures.
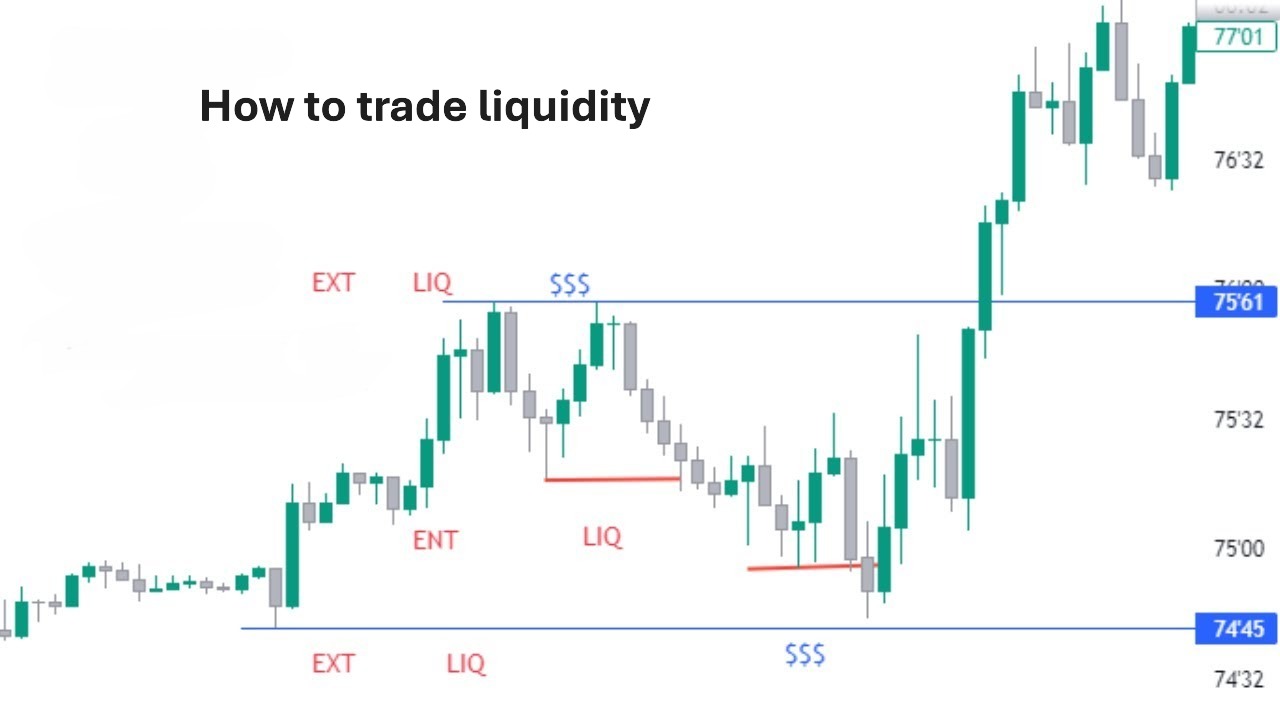
The role of liquidity and order flow in failed breakouts
The market enables liquidity because it allows traders to perform both buying and selling activities at different market prices. The foreign exchange market shows uneven liquidity distribution because trading activity tends to focus on areas near previous market peaks and troughs and specific psychological price levels. The central bank data and major market reporting shows that institutional investors place their orders within these specific areas. The market operates stop-loss and pending order systems at their peak when prices reach these extreme points.
The EUR/USD price shows repeated attempts to reach 1.1000 but fails to do so. Traders may place buy stops above that level and protective stops below recent lows. The market will trigger these orders when prices rise above 1.1000 for a short period which will lead to increased trading activity. The market price will rapidly change direction when investors stop buying because they lack enough money to continue their investments. The observed pattern stems from market order flow patterns instead of strong investor confidence.
Key technical conditions that increase the probability of a false breakout
The presence of particular technical market conditions increases the chances that a breakout attempt will fail to succeed. Weak momentum represents a typical element which appears in this situation. The market shows weak purchasing ability when price moves past resistance because the candle body remains small while the price stops at the breakout point. On the trading platforms this can be identified by reduced follow-through in the next few candles.
The AUD/USD exchange rate maintains a position above 0.6600 during periods of minimal market trading. The market shows higher chances of short-term market imbalances driving price changes instead of long-term market interest when it occurs without causing market volatility to rise or price levels to stay stable. The market shows exhaustion through price movements which return to their previous range after a breakout occurs.
The second condition occurs when price indicators on retail platforms show different values than momentum indicators which are also used on these platforms. The market shows potential weakness in its upward movement when price reaches a new high but momentum indicators do not support this advance. The evaluation process achieves better accuracy through its combination of historical market volatility data with trading patterns which occur during market hours. The combination of structure analysis with volatility assessment and timing considerations enables investors to identify untrustworthy breakouts more effectively while they enhance their investment risk management.
Volume, volatility, and confirmation signals
The evaluation of breakout strength needs quantitative data which includes volume and volatility measurements. In spot forex, centralized volume data is limited, but currency futures markets offer reliable participation metrics. The market shows greater likelihood of continuing its present trend when breakouts happen while futures market trading volume rises and market volatility reaches higher levels. The market shows limited conviction when price movements exceed certain levels without any increase in trading volume.
For example, let’s say EUR/USD breaks above 1.0950 during a major data release listed on Forex Factory. The market shows increased volatility but trading activity in futures remains low while the price returns to 1.0950 which indicates a possible short-term market response instead of enduring buyer demand. Users can measure market conditions through average true range and session volatility analysis which they can access through any trading platform.
The confirmation process requires us to examine the structure which candles possess. The market expansion continues because it stays above the breakout point during all subsequent trading sessions. The market displays warning indicators because its closing prices fail to persist and it quickly opposes any price changes.
The importance of multi-timeframe analysis
The evaluation of breakouts becomes more effective through multi-timeframe analysis because it demonstrates how short-term market movements connect to the bigger structural patterns. The significance of a level becomes different when you move from a 15-minute chart to a daily chart. The analysis of higher timeframes enables traders to detect primary market trends while they can also locate essential support levels and resistance points and understand market volatility patterns.
The 30-minute USD/JPY chart shows the price breaking through its resistance level according to analyst observations. The daily chart indicates that price movement is heading toward a long-term resistance zone which caused previous strong market sellouts thus lowering the chances of market continuation. The reliability of breakouts becomes stronger when both daily charts and intraday charts show the same market direction.
The direction of higher timeframes depends on economic trends which central banks including the Federal Reserve and the Bank of Japan make public. Organizations can improve their decision-making capabilities through the analysis of technical system interactions with market environment factors.
Risk management techniques for trading around breakouts
The process of breakout trading needs risk management systems because market volatility tends to increase quickly when prices approach their critical points. The calculation of position sizing needs to occur before traders start their market entry. A trading account contains $10,000 while each trading transaction must not exceed 1 percent of the total amount. The total amount of acceptable loss reaches $100. The stop-loss trigger needs to be set at 25 pips because the pip value needs to match the $100 limit. On a standard lot in most USD pairs, one pip equals approximately $10. The $100 risk level would stay unchanged when trading with 0.40 lots because this position size would produce about $4 per pip movement.
Margin and leverage must also be considered. The use of higher leverage levels makes investments more vulnerable to market fluctuations but it does not decrease the fundamental level of risk. The required margin amount becomes visible on trading platforms before traders can execute their orders which allows them to make precise calculations.
The placement of stops needs to follow established structural guidelines instead of depending on personal preferences. The placement of stops above invalidation points instead of at breakout levels helps traders avoid getting affected by brief market price fluctuations. The combination of uniform position sizes and established exit points and strict leverage management helps traders maintain stability throughout market volatility during breakout events.
Conclusion
The ability to identify false breakouts with precision develops through following a structured approach which includes risk measurement and executing trades according to plan. The foreign exchange market remains highly liquid and reactive to macroeconomic developments published by central banks and major financial institutions. The market shows regular short-term price increases which become most apparent when major games become available in the market. The evaluation process between short-term market changes and long-term market patterns requires particular assessment procedures.
A practical trading method uses multiple time frame analysis of market structure and candle close verification and volatility measurement and established risk parameters. The market shows a promising breakout but it happens before the Federal Reserve and European Central Bank will make their interest rate decisions. The investor needs to wait until market stability returns after the announcement because this strategy enables him to steer clear of unanticipated market volatility.