How to identify forex trends early
The formation of trends occurs through the combination of technical patterns with momentum shifts and macroeconomic developments. A sudden change in central bank interest rates creates a new price direction in currency pairs. Technical indicators which include moving average crossovers and breakouts from consolidation zones serve as the first visual indicators of potential trend developments. Early identification involves identifying new market behaviors through objective data while confirming price action patterns.
The EUR/USD and USD/JPY and GBP/USD currency pairs demonstrate structured market patterns which traders can analyze across different time periods. A higher low or failed break of a long-standing support level often indicates the start of trend development after a range-bound market. Traders who depend only on lagging signals while entering late in the cycle risk unnecessary exposure to market dangers.
What Is a forex trend?
The forex market defines a trend as the overall price movement direction of currency pairs during a particular time span. A clear trend may be upward (bullish), downward (bearish), or sideways (consolidating). The fundamental step to identify beneficial market conditions begins with understanding this basic trend classification.
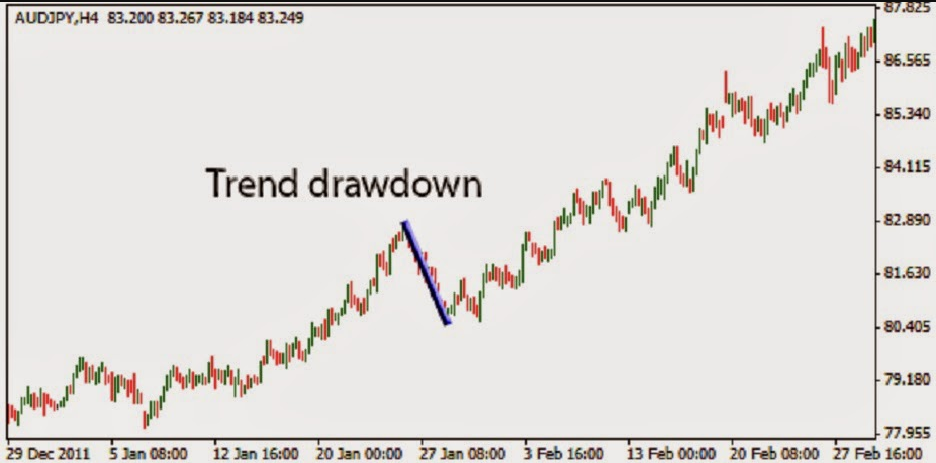
An uptrend emerges through the formation of consecutive higher highs and higher lows that demonstrate increasing buying activity. The price movement in downtrends displays both lower highs and lower lows which indicate continuous selling pressure. The price movement in sideways markets known as ranges shows price fluctuations between defined support and resistance zones without any dominant direction.
The duration of trends exists across different ranges. The duration of short-term trends extends from minutes to hours and they primarily result from intraday news events and volatility spikes. The duration of medium-term trends extends from days to weeks and they tend to match economic release schedules. Long-term trends persist for multiple months or longer periods because they result from macroeconomic policies together with interest rate differentials and geopolitical developments.
The EUR/USD pair demonstrates daily chart higher closes after a European Central Bank rate hike. A price trend toward an uptrend may start when successive higher lows appear and resistance levels get broken.
Why identifying trends early matters
The identification of trends at their initial stages enables traders to establish better trading positions while controlling their risks more effectively. The discovery of a trend at its beginning point allows traders to establish positions near the trend's origin which results in better risk-to-reward ratios. The strategy minimizes price chasing behavior while preventing traders from entering positions near trend cycle endings where reversals or consolidations tend to occur.
The GBP/USD pair starts to rise above its previous resistance level as volume grows while the four-hour chart shows increasing lows. The signals point toward the beginning of an upward trend. Such confirmations enable traders to make structured decisions through observable behavior instead of speculative actions.
The knowledge of market direction enables traders to select appropriate trading strategies while choosing suitable technical indicators and determining stop-loss and take-profit levels with better precision. This method promotes trading consistency while minimizing impulsive decisions caused by market noise or short-term price fluctuations.
The early identification of trends enables portfolio management through high-probability trade alignment while minimizing counter-trend exposure. Market movements frequently result from economic news together with central bank policies and geopolitical developments. Technical analysis becomes stronger when traders understand how directional bias begins to form from market factors.
Key tools for early trend detection
The detection of early trends requires analysis of price structures together with momentum indicators and confirmation tools. Multiple technical methods used together produce more reliable trend identification than any single approach does.
The actual price movements of currency pairs serve as the foundation for early trend recognition because they do not depend on delayed indicators. The USD/JPY currency pair demonstrates a higher low pattern following its successful break above past resistance levels. The price action indicates that market sentiment has started to move from consolidation to an emerging uptrend. The trend reversal signals emerge from candlestick patterns which include bullish engulfing patterns and pin bars located at support zones.
Price fluctuations become smoother through moving averages which help traders determine market direction. A "golden cross" appears when the 50-period exponential moving average (EMA) crosses above the 200-period EMA which typically indicates bullish market momentum. The position of short-term and medium-term and long-term EMAs relative to each other helps traders determine the trend's power.
The combination of trendlines and price channels enables traders to detect market direction and potential breakout areas. A trendline that connects higher lows in an upward direction combined with rising volume indicates bullish continuation potential.
The MACD and Relative Strength Index (RSI) serve as momentum tools which provide additional evidence to traders. The start of a trend often occurs when the MACD histogram crosses the zero line or the RSI moves from its neutral zone (50 or below) into a bullish territory (above 50). The effectiveness of these tools increases when used together with volume indicators or price structure analysis to prevent false signals.
Combining technical indicators for confirmation
Multiple indicator usage together boosts the chances of identifying an emerging trend correctly. A moving average crossover signal alone indicates momentum but without additional confirmation tools it may trigger premature entries or incorrect trend assumptions. The combination of indicators provides an organized method to eliminate weak trading opportunities.
The EUR/USD pair breaks above its consolidation range at the same time that a bullish MACD crossover occurs near the zero line. The emerging uptrend becomes more likely when RSI surpasses 50 and the 20-period EMA starts to rise while the EUR/USD pair breaks above its consolidation range. The trend direction and entry timing become more reliable when different indicators align in a pattern known as confluence.
The combination of multiple criteria through Confluence enables traders to reduce their risk exposure by selecting trades that fulfill all specified conditions. A pullback entry becomes more valid when trendlines combine with Fibonacci retracement levels and volume confirmation. The setup becomes more actionable when price reaches the 50% level while following a rising trendline and showing increased volume during the bounce.
The analysis should include examination of different timeframes. A one-hour trend becomes more significant when it matches the direction of four-hour or daily market movements. The verification process across different timeframes helps minimize the risk of entering during short-term market noise.
Linking fundamental analysis with trend detection requires
Early trend identification becomes more effective when technical signals receive backing from fundamental analysis. Macroeconomic data together with central bank decisions and geopolitical developments function as catalysts which create trends in the market. Technical patterns become more reliable when traders understand the fundamental drivers that support them while avoiding trades which go against market sentiment.
When United States inflation data surpasses market projections and the Federal Reserve indicates additional monetary tightening measures. The USD strengthens because interest rate projections undergo upward adjustments. The fundamental environment supports the trend credibility when the USD/JPY pair demonstrates a bullish breakout pattern on its daily chart. The fundamental context helps traders recognize the full potential and duration of market movements.
Price movements triggered by scheduled events including central bank meetings and GDP releases and employment reports tend to develop into market trends. Traders can gain valuable insights about upcoming volatility increases and directional bias changes by monitoring scheduled economic releases through an economic calendar.
Interest rate differentials are particularly important. The value of currencies increases when their nations implement rising interest rates particularly when compared to countries with dovish monetary policies. The USD tends to strengthen against the euro when the yield gap between US dollar and euro increases.
Developing a trend-following mindset
The AUD/USD pair shows higher highs and higher lows across its four-hour and daily charts. A disciplined trader waits for price to enter a support zone or moving average before entering the market instead of making an immediate entry after a strong bullish candle. Such behavior demonstrates both patience and a proper understanding of setup quality.
The main requirement for trend-following success includes avoiding excessive trading activities. The market tends to consolidate between its impulsive movements thus entering during periods of low volume or sideways activity increases the risk of stop-outs. A rule-based system which requires price alignment across multiple timeframes and indicators helps traders maintain consistency and minimize unnecessary risk exposure.
The approach of following trends requires traders to establish realistic performance targets. Trends sometimes fail to produce extensive price movements and some trends experience sudden reversals. Technical structure analysis combined with market conditions enables traders to establish predefined stop-losses and target levels which provide both protection and clear execution guidelines.
Conclusion
The early detection of forex trends requires both technical precision and fundamental awareness together with disciplined execution. A reliable trend consists of price movement in one direction which receives momentum support and timeframe confirmation and macroeconomic fundamental drivers. The combination of structured tools including moving averages and RSI and MACD with chart pattern analysis and volume and news flow validation enhances trading accuracy and decreases incorrect market entries.
GBP/USD breaks out of a key resistance zone while interest rate expectations for the UK rise. The trend signal becomes stronger when the price move is confirmed by a rising 50-period EMA together with increased volume. The process of integrating confirmation through repetition enables traders to develop stronger confidence in their decision-making abilities.
A trading outcome becomes more consistent when traders avoid three common mistakes which include overtrading and indicator dependence and ignoring longer timeframes. A trend-following mindset based on evidence rather than impulse leads to steady performance and minimizes emotional reactions during market fluctuations.