How to use support and resistance levels in forex
Technical analysis traders use support and resistance levels as fundamental concepts to analyze market behavior and predict price changes. Price charts display these levels as historical areas where markets tend to pause or reverse direction or consolidate. The asset price finds support at a particular level because buyers demonstrate sufficient interest to stop its decline yet resistance occurs at a level where sellers create obstacles to price increases.
The Forex market operates 24 hours daily across global time zones so traders who understand support and resistance levels make better decisions. The levels enable traders to spot potential market entry and exit points while improving their risk management and helping them determine between trending and ranging markets. The approach of price towards a recognized support zone indicates a possible buying opportunity when supported by additional technical indicators and market conditions. The identification of resistance helps traders predict when price rallies will lose their upward momentum.
Support and resistance operate as reactive tools because they base their predictions on past price movements to forecast future possibilities. The combination of support and resistance levels with moving averages and Fibonacci retracements and candlestick patterns provides valuable information to traders at all experience levels
What are support and resistance levels?
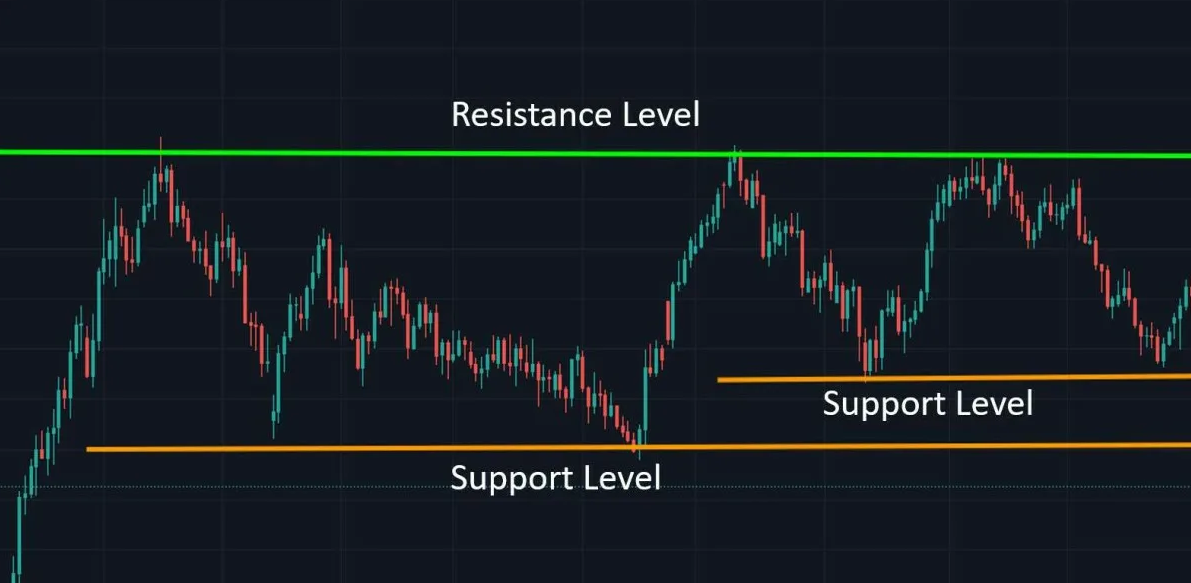
The market shows pauses and reversals and accelerations at specific price points which become known as support and resistance levels on charts. The market price finds support at levels where historical demand has proven strong enough to prevent further declines. Resistance acts as a price barrier which selling pressure maintains to prevent market price increases.
The EUR/USD pair has shown multiple instances of price drops to 1.0600 before prices rebounded. The area functions as support because previous market buyers have entered the market at this point. The price area at 1.0800 functions as resistance because the market fails to advance beyond this level repeatedly.
The market creates these levels through the combined actions of all participants. The market significance of these levels increases when numerous traders execute buy or sell orders at the same price point. Support and resistance operate as price zones instead of precise levels. The number of unsuccessful price tests at a level increases its future market attention.
Support and resistance also change roles. A support level that price breaks through will transform into resistance when price makes a retracement. The observed behavior exists across different timeframes thus traders need to analyze these levels through both short-term and long-term perspectives.
The significance of support and resistance levels in forex trading
The Forex market employs support and resistance levels extensively because they help traders identify possible price reaction areas. These levels enable traders to identify market zones where price action might pause or change direction. The patterns hold particular importance for traders who operate in Forex markets because small changes in market sentiment can trigger rapid price movements.
A trader observes the GBP/USD pair consistently bouncing back from 1.2700. Market participants view this level as a support zone because they find value at this point. The price of the pair encounters difficulties when attempting to surpass 1.2900 which makes this level function as resistance. The observations enable traders to establish precise risk-reward boundaries for their trading setups.
Market structure depends heavily on support and resistance levels for its identification. Price movements above resistance levels typically indicate that an upward trend will continue. A price drop below support levels signals the beginning of a downward market trend. Trading opportunities emerge when breakouts gain validation from volume data and other technical indicators.
The practical use of support and resistance levels extends to managing trades. Traders position their stop-loss orders below potential demand zones and set their take-profit targets near anticipated resistance areas. The structured approach enables traders to maintain control over their losses and secure their profits.
How to identify support and resistance levels
The process of identifying support and resistance levels requires analysis of historical price movements. The simplest approach to identify these levels involves drawing horizontal lines at points where price has repeatedly reversed or paused. Multiple touches without a decisive breakout make these levels most effective. The area at 155.00 USD/JPY shows potential to function as support because price has bounced back there multiple times during the specified period.
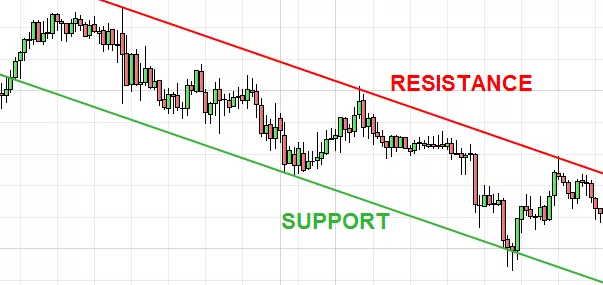
The identification of support and resistance levels can be achieved through the use of trendlines. An upward trendline that connects successive higher lows functions as dynamic support. A downward trendline that connects lower highs serves as resistance. Trendlines enable traders to see market direction and price reaction points during market pullbacks and rallies.
Moving averages serve as tools to detect support and resistance levels that adjust with market conditions. The 50-day simple moving average functions as support during an upward trend but transforms into resistance during a downward trend. Traders frequently use moving averages as entry and exit signals when price consistently reacts to these indicators.
Fibonacci retracement levels serve as an additional tool for traders to analyze market behavior. The EUR/USD currency pair experienced a price movement from 1.0500 to 1.1000. The 61.8% retracement level at 1.0680 might function as support but its effectiveness depends on additional indicator alignment and price history.
How to use support and resistance in real trading
The practical use of support and resistance levels helps traders execute trades while managing risk and enhancing their overall strategy. The identified zones function as optimal entry and exit points when traders use them in combination with price action or technical indicators.
EUR/USD has experienced multiple bounces at 1.0800 which has established this level as support. A bullish candlestick pattern such as a hammer or engulfing candle near the 1.0800 level could indicate a potential long trade when price approaches this level. A short trading opportunity may emerge when price approaches 1.1000 resistance and forms a bearish reversal pattern like a shooting star.
Traders use stop-loss orders which place them below support levels and above resistance levels to minimize market noise-related stop-outs. Take-profit targets should be placed near the following significant level. This method provides a systematic way to establish risk and reward parameters.
The Relative Strength Index (RSI) and Moving Average Convergence Divergence (MACD) indicators assist traders in validating their trades when support or resistance levels are involved. The probability of a price bounce increases when RSI shows oversold conditions during support testing.
Common mistakes to avoid when using support and resistance
The Forex trading community uses support and resistance levels extensively but their use without proper context or confirmation leads to incorrect decisions. People frequently mistake support and resistance levels for precise points instead of recognizing them as zones. Price tends to cross levels by a few pips before it reverses direction. The practice of viewing support and resistance as flexible areas helps traders avoid premature market entries and exits.
The majority of traders make the mistake of disregarding the timeframe when trading. A level which shows significance on a 5-minute chart usually lacks importance on a 4-hour chart. Support and resistance become more reliable when they align across multiple timeframes especially when the levels coincide.
A trader who buys near support without waiting for price action or indicator signals to confirm their decision may make an incorrect trade. The continuation of price decline after entering a trade can lead to unneeded losses. The process of waiting for validation through candlestick patterns or bullish divergences on oscillators decreases the likelihood of making false trading decisions.
Traders make a common mistake by not updating their levels after major price movements or changes in market volatility. Support and resistance zones need regular updates because fast-moving markets cause them to shift. The use of outdated levels creates incorrect representations about current market sentiment.
Advanced tips for using support and resistance
The combination of support and resistance levels with advanced tools and techniques leads to more precise market predictions. Multi-timeframe analysis is one such approach. The resistance level on the 4-hour chart matches a resistance zone on the daily chart. The level becomes more reliable when it appears on multiple timeframes which increases the chances of price reacting at that point.
Volume analysis serves as a tool to enhance the precision of support and resistance levels. A resistance level break with increased trading volume indicates a stronger breakout potential. A low-volume breakout indicates weak market activity which may result in price returning to previous levels or creating a false breakout. The technical chart platforms enable users to view volume data together with their charts.
These zones receive influence from institutional order flow. Large traders execute their positions through multiple stages. Price tends to pause at specific levels because institutional traders cluster their interest at these points. The presence of institutional activity becomes evident through sudden spikes in market volatility and rapid price rejections. Once these areas are identified they become useful for predicting future price turning points.
Conclusion
The Forex market requires support and resistance levels as essential tools to understand market activities and execute trades while controlling risk exposure. Market participants' psychological behavior creates these levels which show the points where price direction changes due to buying or selling interest. The combination of support and resistance levels with trendlines and moving averages and volume data creates a systematic method to study price movements.
A trader who observes a defined support zone on the EUR/USD daily chart will use a bullish reversal confirmed by the Relative Strength Index to make their trading decision. The combination of multiple signals with this setup enhances both the clarity and confidence level of the trade. The absence of confirmation when trading on a level exposes the trade to avoidable risks.
The quality of trading strategies improves when traders learn to use support and resistance levels across different timeframes while adjusting them to market volatility and integrating economic calendars and institutional data. The charting tools enable users to test and improve their techniques through both real-time and historical market analysis.