Price action trading strategy explained
Price action trading is the practice of making trading decisions based on a currency pair's raw price movement — no indicators layered on top, no oscillators, no moving averages smoothing out the noise. Just the chart, the candles, and the patterns they form over time.
In this approach, the premise is that price already reflects all relevant information — whether that is upcoming earnings announcements, impending interest rate decisions, or the shifting landscape of global geopolitics. Direct engagement with price is therefore treated as more immediate than studying a derivative of it.
Most people imagine that price action trading is a straightforward approach, where all a trader needs is a grasp of the basics. While it is true that price action does not rely on extensive indicators, that is not to say it is simple. Reading charts accurately and in a timely manner is one of the hardest aspects of the discipline. Even experienced traders struggle to identify candlestick formations reliably, locate the precise levels where buyers and sellers have historically engaged, and — hardest of all — pinpoint shifts in momentum before a move develops. These are learnable skills, but they take time to build.
The approach is flexible and can be applied across different timeframes, from five-minute charts to weekly analysis, and adapts to most currency pairs without adjustment.
How price action differs from indicator-based trading
When starting out, retail traders often reach for indicators that come built into most charting platforms — the Relative Strength Index, MACD, Bollinger Bands. These tools carry the appeal of objectivity: a line crosses another line, and something is supposed to happen. But what traders sometimes fail to recognise is that all of these tools are derived from price. They calculate, average, or compare historical price data and display the result. By definition, they lag.
Price action removes that layer. Instead of waiting for an indicator to confirm what price has already done, a price action trader reads the raw move as it forms. A long lower wick on a candlestick communicates something directly: sellers pushed price down during the session, buyers stepped in hard, and price closed near the top of the range. No RSI reading required.
That said, this is not an argument that indicators are useless. Many experienced traders combine both approaches. The distinction worth making is that price action traders treat price as the primary signal, with any indicator serving only as secondary confirmation. That shift in hierarchy changes how a trader reads a chart — what they notice first, what they wait for, and when they act.
Key chart patterns every price action trader recognises
Chart patterns are not decorative. They represent documented instances where price has behaved in a recognisable way, often enough that traders treat them as probabilistic signals rather than guarantees.
The pin bar is one of the most referenced. It has a small body and a long wick — the wick pointing in the direction price attempted to move but failed to sustain. On a daily chart near a known resistance level, a bearish pin bar indicates that sellers attempted to drive price lower but buyers pushed back, with the session closing near the open. The wick length relative to the body is what gives the pattern its significance.
An inside bar is a candle that forms entirely within the high-to-low range of the preceding candle. Inside bars signal market compression — a pause in volatility that can precede either trend continuation or reversal. Context determines which interpretation carries more weight.
Then there are larger structures: head and shoulders, double tops, double bottoms. These take longer to form and require more price history to validate, but they tend to produce more significant moves when they complete. Patience — waiting for the full pattern to develop rather than anticipating it — is where the real edge tends to sit.
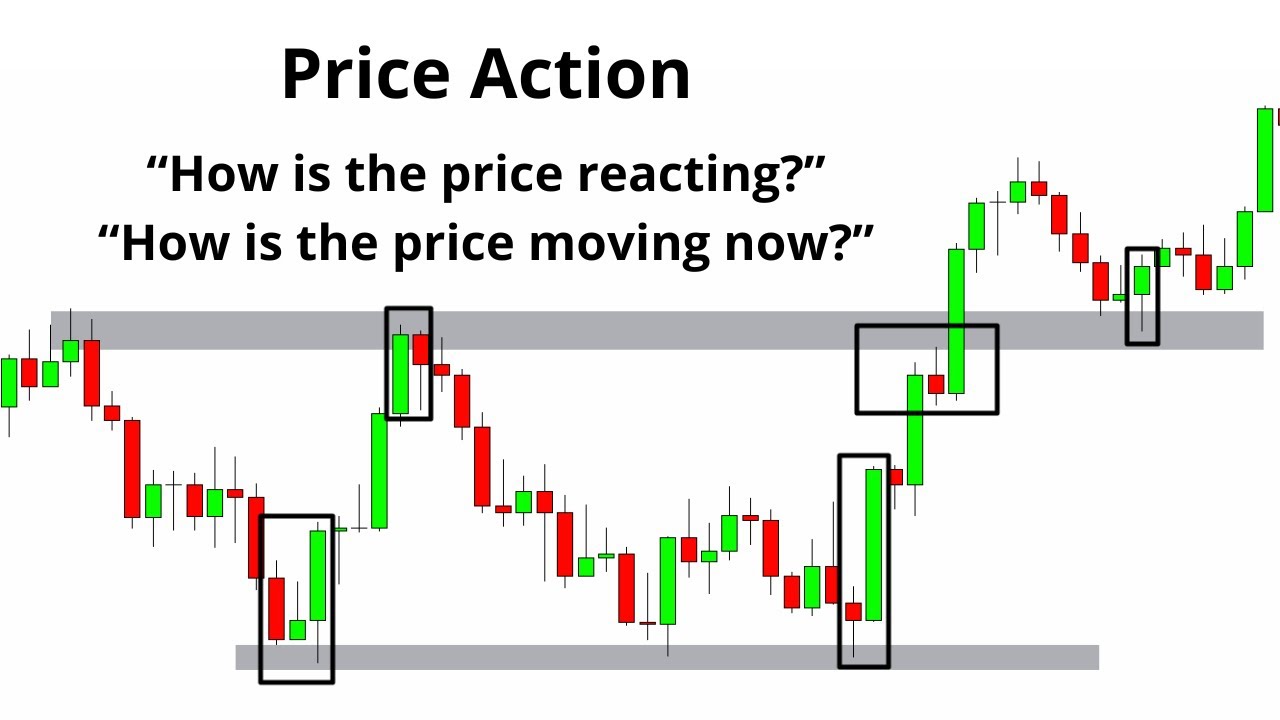
Support and resistance: the foundation of price action analysis
Support and resistance are a crucial component of price action analysis. Support refers to a price level where historical buying pressure has been strong enough to halt a decline. Resistance is the inverse — a level where historical selling pressure has repeatedly capped upward moves. These levels are defined by areas where large volumes of orders have clustered in the past.
Identifying them requires looking left on the chart. Where did price reverse sharply? Where did it stall multiple times before breaking through? The more times a level has been tested and held, the more significant it is considered to be.
A common mistake among newer traders is expecting these levels to be hit exactly. In reality, support and resistance are zones, not precise lines. Price rarely respects a level to the pip, and allowing a small margin — a few pips either side — tends to produce more realistic analysis than expecting surgical precision.
When a level breaks, the relationship often flips. A broken support level frequently becomes resistance on a retest, and vice versa. Technical analysts refer to this as role reversal. It shows up consistently across Forex pairs and timeframes, and understanding it changes how traders plan re-entries after a breakout.
Candlestick signals and what they actually tell you
Candlestick charts are believed to have originated in Japanese rice trading in the 18th century, and the tool remains widely applied in Forex trading today. Each candle encodes four data points — open, high, low, and close — and the relationship between those four values communicates what market conditions prevailed during that period.
A candle with a large body and small wicks indicates decisive price movement, with little contested ground between open and close. A candle with a small body and long wicks on both sides signals indecision — buyers and sellers pushed price in both directions but neither took control.
Where candlestick analysis becomes genuinely useful is in combinations. A bearish engulfing pattern — where a bearish candle's body completely covers the body of the preceding bullish candle — signals that sellers overwhelmed buyers in a single session, and may mark a turning point.
Context matters more than the pattern itself, and this is frequently underemphasised. A bearish engulfing candle forming in open air carries little significance. The same candle forming at a well-established resistance level, after a sustained uptrend, is a different proposition entirely.
Building a price action strategy: timeframes, pairs, and entry logic
A price action strategy without a defined structure is just chart watching. The difference lies in having consistent criteria: which timeframe drives the analysis, which currency pairs are in scope, and what conditions must align before an entry is considered.
Most price action traders work with a top-down approach. Analysis begins on a higher timeframe — daily or four-hour — to establish the broader trend and identify key levels. Entries are then refined on a lower timeframe, such as the one-hour or fifteen-minute chart, where the specific candlestick signal forms.
Currency pair selection matters more than it might seem. Major pairs like EUR/USD and GBP/USD tend to produce cleaner price action than exotic pairs, largely because of higher liquidity and tighter spreads. Low-liquidity pairs can generate erratic price movement that produces misleading signals — patterns that appear valid on the chart but reflect thin market conditions rather than genuine sentiment shifts.
Entry logic should be rule-based. For example: price retraces to a key support level on the daily chart, a bullish pin bar forms on the four-hour chart, and the broader trend is upward. All three conditions present — entry is valid. One missing — wait. Discretion has a role, but a clear rule-based structure prevents impulsive decisions.
Risk management within a price action framework
Identifying a quality setup is only half the job. Without a coherent risk management framework, even a strategy with a sound win rate can produce a negative outcome over time.
Stop-loss placement in price action trading is structural, not arbitrary. Rather than setting a stop at a fixed pip distance, the stop is placed beyond the level that would invalidate the trade premise. On a long position entered from support, the stop sits just below that support zone. If price breaks through the level that justified the entry, the trade premise is gone.
Position sizing follows from stop placement, not the other way around. Once the stop distance is known, position size is calculated so that the potential loss represents an acceptable percentage of the account — typically between one and two percent per trade. This keeps individual losses contained regardless of how far price moves.
For example: the stop is set 40 pips from entry, and the trader is risking one percent of a ten-thousand-dollar account — that is one hundred dollars at risk. Position size is then calculated so that a 40-pip adverse move produces exactly that loss.
Risk-to-reward ratio matters too. Setups where the potential gain is less than twice the potential loss deserve scrutiny regardless of how clean the pattern looks.
Common mistakes and how to avoid them
The most persistent mistake among traders learning price action is pattern recognition in isolation. A pin bar or an inside bar is not a signal by itself — it is a signal in context. Traders who memorise patterns without understanding the broader structure around them tend to overtrade, finding setups where none genuinely exist.
Confirmation bias compounds this. There is a tendency to first decide which direction a pair should move, and then seek only the evidence that supports that view. Sound price action analysis requires forming a view from the chart, not retrofitting the chart to a pre-existing view.
Timeframe confusion is another common issue. Switching between timeframes mid-analysis — particularly when the original read stops working — produces contradictory signals and indecision. The higher timeframe should anchor the analysis. The lower timeframe refines the entry. That hierarchy should not be reversed when price moves inconveniently.
Finally, not all support and resistance levels carry equal weight. Levels that have been tested repeatedly, that align with round numbers, or that coincide with previous swing highs and lows tend to produce more reliable reactions. Prioritising quality over quantity — fewer, higher-conviction setups rather than constant activity — is an adjustment that consistently separates developing traders from experienced ones.