Swing failure patterns (SFPs) in advanced trading systems
The market generates Swing Failure Patterns known as SFPs when prices make brief contacts with previous swing highs and swing lows before prices begin their rapid movement in the opposite direction. In foreign exchange markets, where daily turnover exceeds trillions of dollars according to central bank surveys, liquidity is concentrated around obvious highs and lows. Stop-loss orders from traders who use lot size and pip value and margin requirements to determine their risk levels tend to appear at these market levels.
Market microstructure and liquidity dynamics behind SFPs
The foreign exchange market functions as a decentralized system which includes banks together with liquidity providers and electronic trading platforms. The data obtained from central banks and derivatives exchanges shows that market liquidity distributes unevenly between different market segments. The system focuses on price levels which investors can easily see including their current swing highs and swing lows. Stop-loss orders and pending breakout entries and option-related flows tend to appear in these market segments.
The GBP/USD exchange rate shows a consistent trading pattern which stays below 1.2800 while creating a defined price limit at this level. Breakout traders may place buy stop orders above that price. Short positions maintain protective stops which are positioned a few pips above their current market value. The market price reached 1.2808 before it returned to values below 1.2800 which indicates that all available liquidity above this level has been consumed. The unsuccessful attempt to break through this level will create a bearish SFP.
For example, if margin requirements are 3.33% under 30:1 leverage, a 1 standard lot position of 100,000 units requires roughly 3,333 units of account currency as margin. Traders can determine their correct market exposure during liquidity events through the process of calculating lot size by using pip value and account balance.
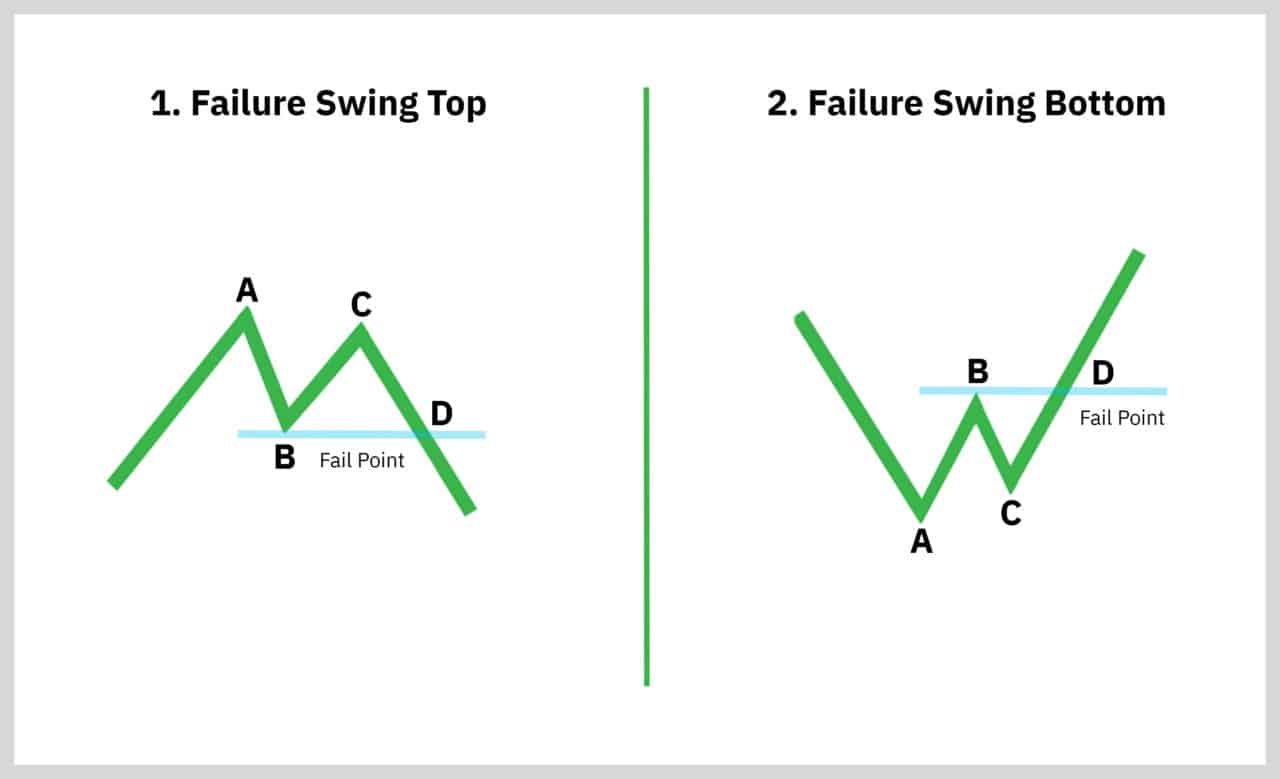
Defining swing highs and swing lows in technical analysis
The swing high occurs when price reaches its highest point before price starts to move downward and creates two consecutive lower highs. Price reaches its lowest point to create a swing low which then leads to successively higher price lows. The visual identification of these structures on charting platforms allows traders to measure distance in pips while they evaluate trading risks before entering the market.
The exchange rate USD/JPY reaches 150.00 before it drops to 149.40 and makes another attempt to rise but stops at 150.00. The 150.00 level becomes a reference swing high. The market signal for a swing failure pattern emerges when price moves above 150.00 by several pips before returning to stay below this level.
A trader who wants to place a 25-pip stop above the swing high needs to set a risk limit of 2% from a $5,000 account to stay within a $100 maximum loss threshold. The position size needs to be set at four mini lots because one pip in a mini lot equals $1 in USD pairs which matches the risk limit we defined.
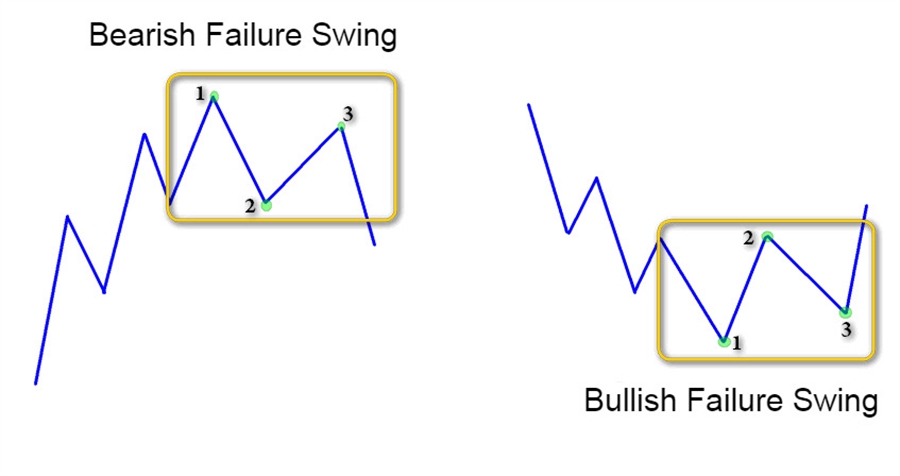
The mechanics of a swing failure pattern
The price breaks through a previous swing high or low before it fails to maintain its position past that specific point which creates a swing failure pattern. The trading process consists of three essential stages which begin with market swing point identification followed by a short price movement in pips before the market reverts to its original range. The last market movement showed that investors lacked enough buying or selling strength to sustain the ongoing trend.
Let’s say EUR/USD forms a swing low at 1.0850. The trading area displays sell stop orders which traders activate to sell their assets when market prices hit particular levels which are lower than their set limits. The market price needs to reach 1.0842 before it can attempt to break out above 1.0850. A bullish SFP develops its fundamental structure through the process of receiving an initial rejection.
The trader should set a stop loss at 15 pips below the failed low point to protect 1.5% of their $8,000 trading account which results in a maximum risk of $120. The position size for trading EUR/USD should be 0.8 lots because one standard lot equals approximately $10 per pip.
Distinguishing SFPs from false breakouts and stop hunts
The pattern which occurs during a swing failure appears like a false breakout but it differs from this pattern through its structural elements and verification process. The general false breakout happens when price breaks through support or resistance levels before prices return to their previous position. The SFP system demands traders to locate their previous swing highs and swing lows before they begin tracking price movements to detect rejection points.
Let’s say USD/CAD trades above a previous swing high by 6 pips but closes the session back below that level. The market data shows that investors lost their ability to continue their market purchases. The market maintains its current direction because price stays above the defined level which spans multiple candle periods.
The trader who controls 0.5 standard lots of 100,000 units maintains control of 50,000 units of currency when margin requirements reach 5% and leverage reaches 20:1. The position size determines the pip value which amounts to $5 per pip so a 30-pip loss would result in $150.
Volume, order flow, and confirmation factors
Traders need to study both volume and order flow data to perform a thorough analysis of swing failure patterns. The spot forex market lacks centralized volume data but futures markets and broker feed aggregation provide valuable information about market participant numbers. The breakout attempt in a valid SFP leads to rising market activity before prices start to decrease when they move back into their previous trading area.
The currency pair EUR/USD maintains its position above the swing high point which occurs during significant economic data announcements. The market shows increased futures trading activity when the breakout occurs but price returns to its original position below the level which indicates that market liquidity consumed all the fast market buying activity. The change in market order activity follows the pattern which the SFP model predicts.
For example, assume a trader plans a 20-pip stop and risks 1% of a $12,000 account, or $120. The position size needs to be six mini lots because trading one mini lot equals $1 per pip. The system which tracks margin usage helps the account to keep enough available margin when market conditions become unstable.
Timeframe alignment and multi-market context
Swing failure patterns become more reliable when traders use them to detect market trends which align with both short-term and long-term market structures and global economic conditions. The expectations of central bank policies together with interest rate differences and economic data announcements create market conditions which affect liquidity levels near major price levels. The analysis of different time periods enables traders to establish if the SFP pattern exists as part of a broader market trend or works against the prevailing trend.
Let’s say EUR/USD forms a bearish SFP on the 1-hour chart near a weekly resistance level while interest rate expectations favor a stronger U.S. dollar. That alignment increases the probability that the rejection reflects sustained order flow rather than short-term noise. The position size for this setup needs to be smaller when the higher timeframe trend shows an upward direction because it needs to protect against countertrend movements.
For example, assume a trader risks 1% of a $15,000 account, or $150, with a 25-pip stop. The position size needs to be six mini lots because one mini lot represents $1 per pip. Traders who check margin requirements before trading will keep their available free margin intact during market volatility which happens when economic data releases become available.
Integrating SFPs into advanced trading systems
Swing failure patterns achieve their best results when traders use them as part of a defined trading strategy instead of making independent trading decisions. Professional trading frameworks combine price structure with macroeconomic context and risk parameters which traders need to follow. The SFP functions as the entry trigger while lot sizing and margin allocation and leverage limits need to be established in advance.
The trading system relies on daily chart trend direction to identify market entry points which occur during 1-hour trading sessions. The system enables short positions when bears create a SFP pattern which develops at resistance levels of higher-timeframe charts. Position size would then be calculated based on account equity and stop distance. The maximum loss amount would reach $250 when equity reaches $25,000 and risk per trade remains limited to 1%. With a 50-pip stop and a pip value of $10 per standard lot, position size would be limited to 0.5 lots.
Conclusion
The Swing failure patterns serve as a method to analyze market liquidity changes which occur at important price levels. The tools function as trading system components because they merge precise lot size measurement with instant pip value calculation and they maintain particular leverage restrictions. The ability of traders to maintain consistency depends on their market exposure management through account value and market volatility levels instead of their ability to predict market trends.