Trend following strategy in Forex
Trend following is one of the oldest and most studied approaches in financial markets, yet it remains widely misunderstood in retail Forex trading. Many traders assume it simply means buying when prices go up and selling when they fall. The reality is more deliberate than that.
At its core, trend following is a systematic method. Traders identify the prevailing direction of a currency pair and position themselves to ride that movement for as long as it holds. The logic is straightforward: markets spend meaningful periods moving in one direction, and capitalising on those periods — rather than trying to predict reversals — is where consistent opportunity lies.
Forex markets are particularly suited to this approach. Currency pairs like EUR/USD or GBP/JPY regularly develop sustained trends driven by macroeconomic divergence, central bank policy shifts, or capital flow differentials. These are not random price movements. They reflect real economic forces playing out over days, weeks, or months.
But trend following requires patience and structure. Neither is optional.
What trend following actually means in forex
The term gets used loosely, and that is part of the problem. Trend following is not discretionary guessing about market direction. It is a rules-based discipline where entries, exits, and position sizing are all defined in advance — and where the trader's job is to execute consistently, not to predict.
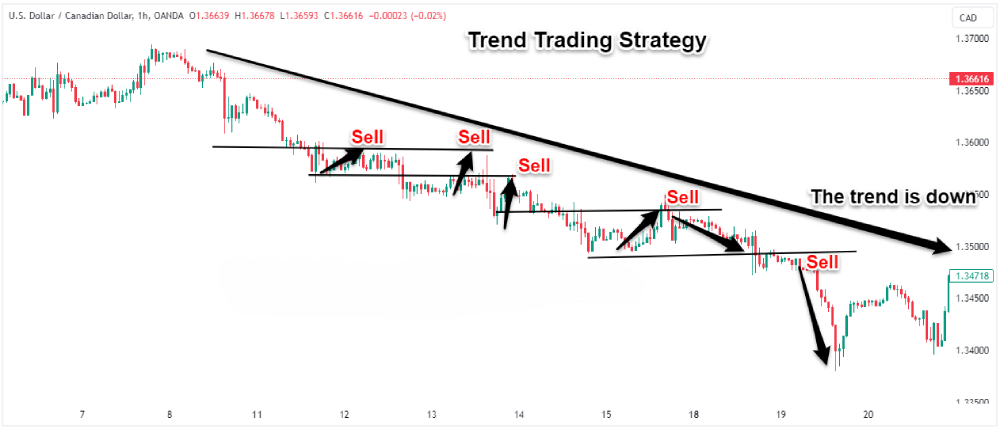
A trend, technically speaking, is a sustained directional price movement marked by a series of higher highs and higher lows in an uptrend, or lower highs and lower lows in a downtrend. This is not a subtle distinction. It separates genuine trends from the noise of ranging or consolidating markets, where trend-following strategies tend to perform poorly.
Forex traders applying this method are not chasing momentum blindly. They are waiting for confirmation that a directional bias has established itself, then sizing into that move with defined risk. The holding period can range from several days in a swing-trading framework to several weeks for position traders tracking macroeconomic themes.
Yet the discipline required to hold a trade through normal pullbacks — without exiting prematurely — trips up a significant portion of traders who attempt this approach.
How to identify a trend
Price structure is the starting point. Before any indicator is applied, the raw chart tells a meaningful story. In an uptrend, each successive peak and each successive trough should sit higher than the last. When that sequence breaks — when price makes a lower low for the first time — that is a signal worth paying attention to.
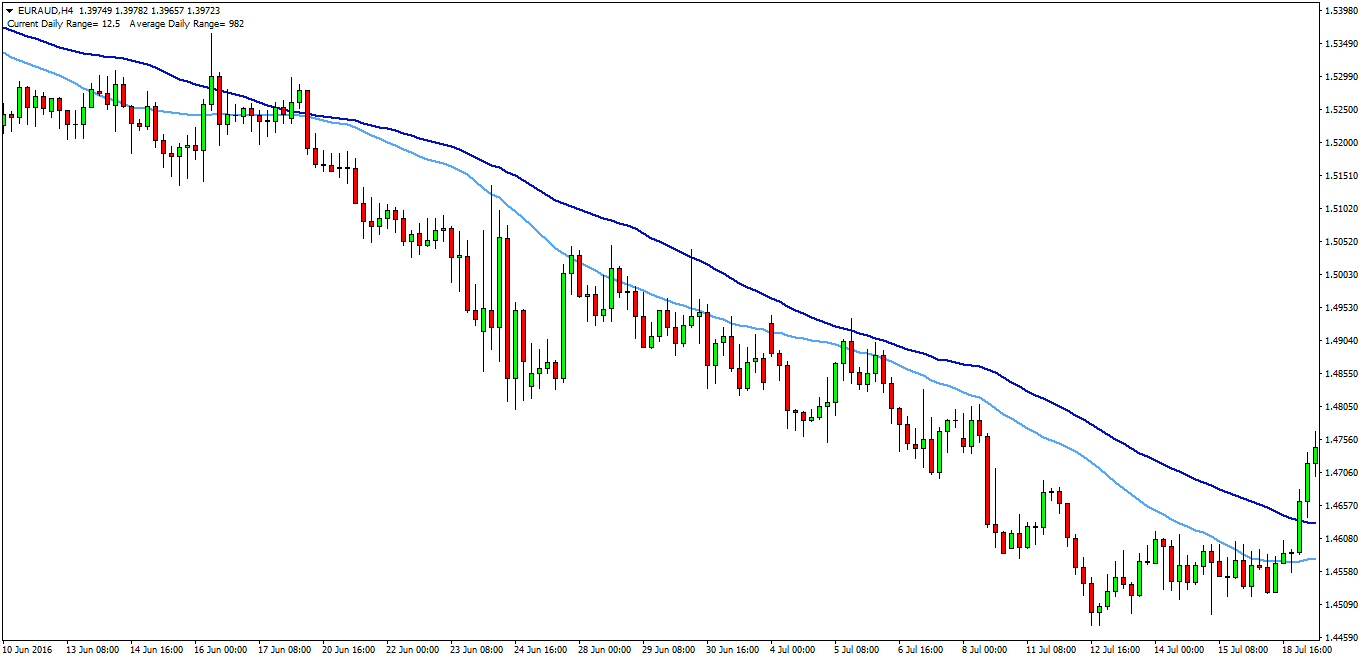
Beyond structure, moving averages are the most commonly used tool for trend identification. A 200-period simple moving average on the daily chart, for example, provides a broad directional reference. Price trading above it consistently suggests a bullish bias; below it, bearish. Many traders layer a shorter-period average — say the 50-period — alongside it and watch for crossovers as early signals of trend development or deterioration.
Let's say EUR/USD has been trading above its 200-day moving average for three consecutive weeks, with each weekly close higher than the last. That alone does not confirm a tradeable trend, but it establishes context. Add a series of clean higher lows on the daily chart and the structural case strengthens considerably.
Higher timeframes carry more weight. A trend visible on the weekly chart generally outranks conflicting signals on the one-hour chart.
Core tools and indicators used in trend following
No indicator works in isolation. That caveat matters, because traders new to this approach often cycle through tools looking for one that delivers certainty. None do. What the right combination delivers is confluence — multiple signals pointing in the same direction.
Moving averages, already discussed for identification purposes, also function as dynamic support and resistance levels. In a strong uptrend, pullbacks to the 50-day moving average frequently attract buying interest before price resumes higher. This is observable across major pairs.
The Average Directional Index, or ADX, is worth understanding separately. It does not indicate direction — it measures trend strength. A reading above 25 generally suggests a trend is in force; below 20, and the market is likely ranging. Applying a trend-following strategy in a low-ADX environment is one of the more reliable ways to accumulate small, frustrating losses.
The MACD — Moving Average Convergence Divergence — is another standard tool. When the MACD line crosses above the signal line in the direction of the prevailing trend, it can support an entry decision. Divergence between price and MACD, meanwhile, sometimes precedes trend exhaustion.
MetaTrader 4 and 5 carry all of these natively. For traders preferring a more visual approach, TradingView's charting environment offers the same indicators with greater flexibility.
Entering and exiting a trend trade
Entry timing matters less than most traders assume. A common mistake is waiting for the perfect moment — the lowest possible entry in an uptrend — and missing the move entirely or entering with no logical structure behind the decision. A more practical framework is to wait for a pullback within a confirmed trend and enter when price shows signs of resuming the primary direction.
For example, in an established EUR/USD uptrend, a pullback to a key moving average followed by a bullish candlestick pattern — such as an engulfing candle or a pin bar — provides a cleaner entry rationale than simply buying because price has been rising. The distinction is between chasing and positioning.
Exits require equal thought. Trailing stops are widely used in trend-following approaches because they allow the trade to run while protecting accumulated gains. A trader might trail a stop below each successive higher low on the daily chart, only exiting when price breaks that structure. Fixed targets, by contrast, often cap gains prematurely in a strong trending environment.
And knowing when a trend is over is not always clean. Price rarely announces the end of a move with precision.
Risk management in trend following
Position sizing is where many otherwise sound trend-following setups collapse. Without a defined approach to how much capital is allocated per trade, a single adverse move can disproportionately damage an account — regardless of how well the strategy identifies trends.
A widely referenced baseline is risking no more than 1-2% of trading capital on any single trade. For a $10,000 account, that means a maximum loss of $100 to $200 per trade. The stop-loss placement drives position size: if the logical stop is 50 pips away on EUR/USD, and the maximum risk is $100, the position size works backwards from that constraint — not from a preferred lot size.
Trend-following strategies also carry an inherent reality: the win rate is often lower than traders expect. Many trend trades are stopped out for small losses before the eventual sustained move develops. The model works because the average winning trade significantly outperforms the average loser — a favourable risk-to-reward ratio compensates for a below-50% strike rate.
Correlation between pairs deserves attention too. Running simultaneous long positions on EUR/USD, GBP/USD, and AUD/USD during the same trend phase compounds exposure to USD movement in ways that may not be immediately obvious.
Common mistakes and how to avoid them
Overtrading is the most consistent problem. Trend following requires waiting — sometimes for extended periods — for valid setups to emerge. Traders uncomfortable with inactivity tend to manufacture reasons to enter, placing trades in ranging or low-volatility conditions where the strategy has no structural edge. The result is a series of small losses that erode capital before a genuine trend develops.
Switching timeframes mid-trade is another recurring issue. A trader who identifies a trend on the daily chart and enters accordingly should not be managing the position using hourly chart signals. The two timeframes carry different noise levels and different structural logic. Mixing them mid-trade introduces conflicting information at exactly the wrong moment.
Then there is the psychology of giving back gains. A trend-following trade that has moved 100 pips in the trader's favour, then retraces 40 pips, feels like a loss — even when it is not. This discomfort leads to premature exits, which systematically undercuts the strategy's return profile. Letting profitable trades run is conceptually simple and behaviourally difficult.
Finally, neglecting macroeconomic context weakens the approach. Central bank divergence, interest rate differentials, and capital flow data from sources like the BIS all provide context for why a trend is developing — and whether there is fundamental backing to sustain it.
Conclusion
Trend following in Forex is not a shortcut and it is not passive. It demands a structured approach to identification, a disciplined entry process, consistent risk management, and the psychological resilience to hold positions through drawdown. Each of those components can be developed — but none can be skipped.
The traders who apply this strategy with the most consistency tend to share a few characteristics: they define their rules before entering the market, they accept that losses are part of the process, and they resist the urge to override their system when it feels uncomfortable. That last point is arguably where the edge actually lives.
Forex markets will continue producing trends driven by the macroeconomic and monetary policy forces that have always shaped currency valuations. Central bank divergence between the Federal Reserve and the European Central Bank, shifts in risk appetite across global markets, capital flow patterns visible in BIS data — these dynamics repeat in different forms across different cycles. A trader who can read that environment and align their positions with prevailing momentum, while managing risk with precision, is working with the market rather than against it.